Inventory: network map
The Network Map draws a graph of resources connected by the traffic between them, clustered by subnet. Node color reflects whether a resource is currently active, and edge thickness scales with traffic volume between two resources. Click a node to open that resource’s detail view. Zoom and pan to move around a large facility.
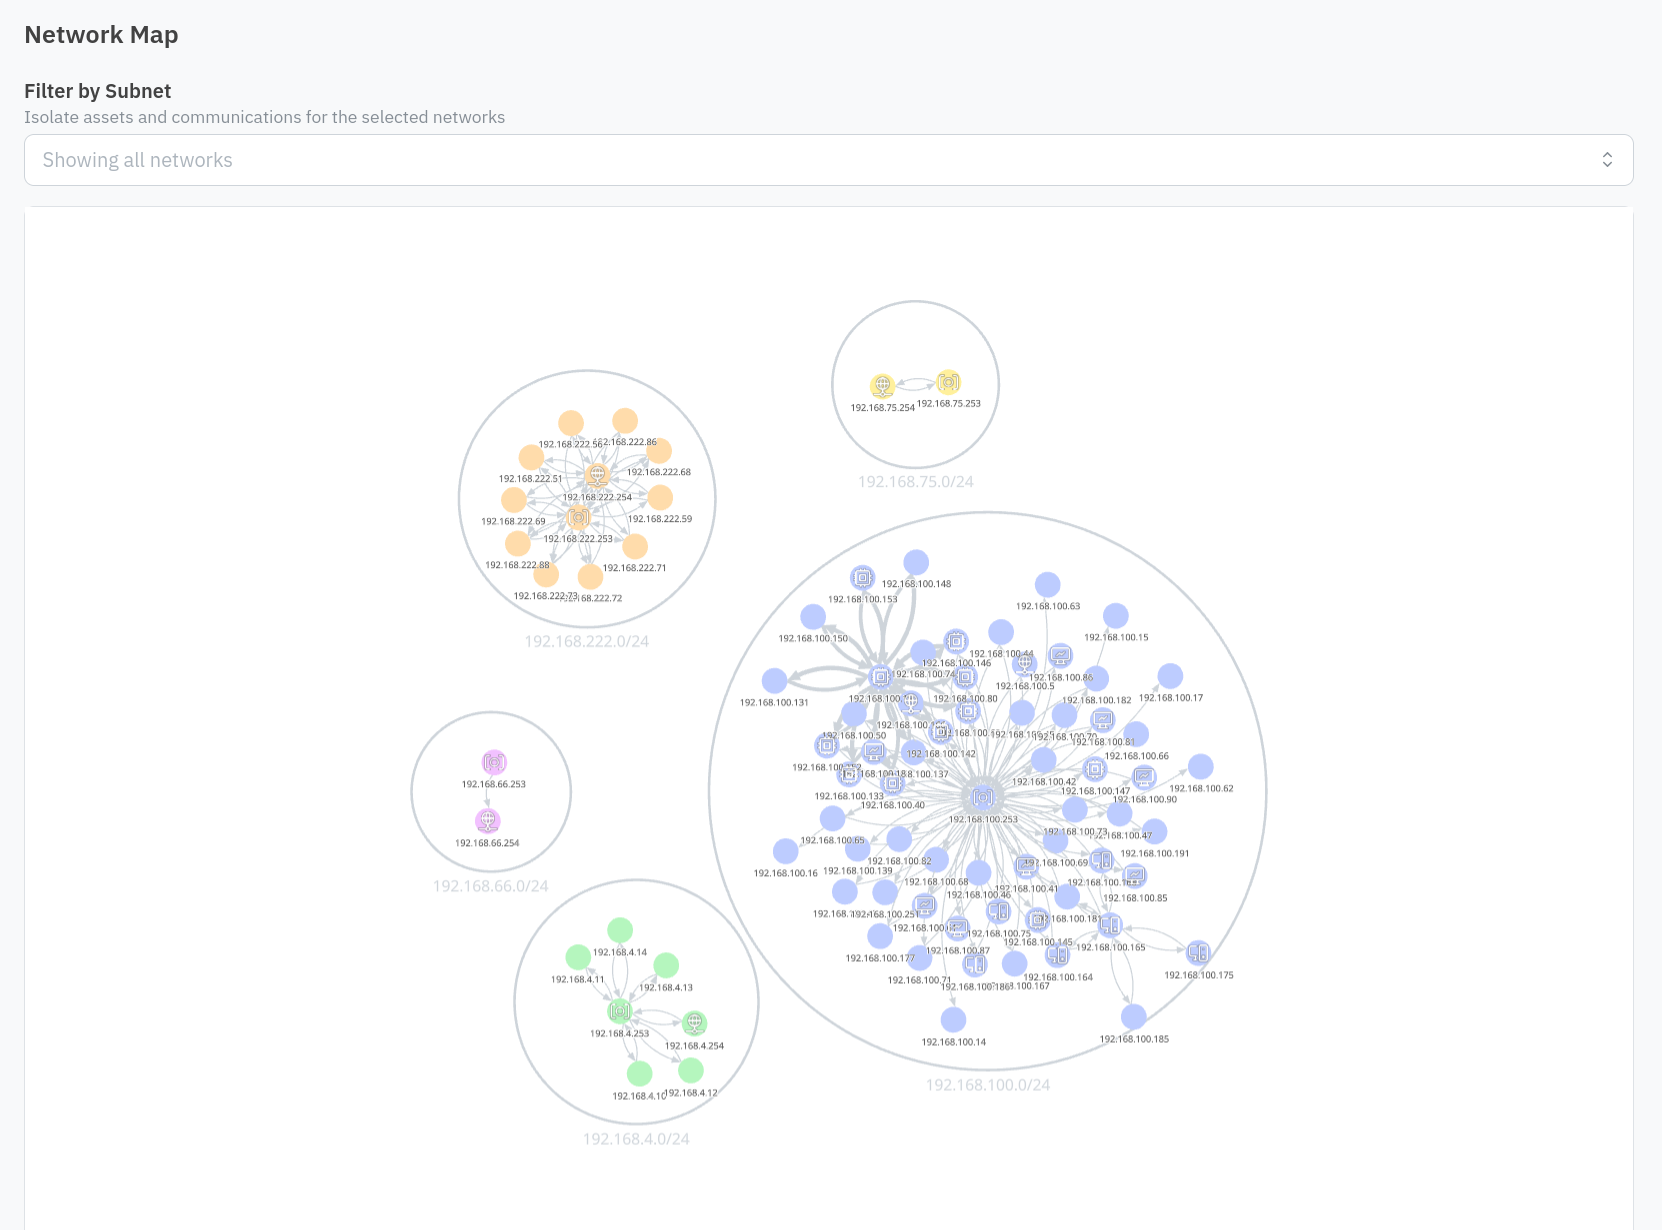
Only resources with active traffic between them appear on the map, so it can look sparse even in a well-populated inventory: a resource that has been discovered but has not communicated with anything else the sensor can see will not show up as a node. If the map looks emptier than you expect, check the Resources table instead to confirm what has actually been discovered, and see Network traffic and flows for what determines whether the sensor sees a conversation at all.
Use Filter by Subnet, above the map, to isolate one or more networks. In a facility with more than 80 resources, the map preselects the largest subnet automatically so the first view is not overwhelming; clear the filter to see everything.