Inventory: resource detail
Click a row in Resources to open its detail view. Seven tabs cover everything the platform knows about that resource.
Overview
If discovery could not fully identify the resource, an amber “Discovery incomplete” banner explains that basic network data is available but detailed device information may be incomplete.
For a device from a manufacturer the platform recognizes, a vendor-specific card appears first (Siemens, Circutor, Moxa, Raspberry Pi, Fortinet, Aruba, Pepperl+Fuchs, SEW Eurodrive, IFM Electronic, Eaton Automation, Keyence, Teltonika, Rockwell, Sungrow, and more), showing whatever model, firmware, or configuration detail that vendor’s protocol returned. See Discovery and the inventory for how vendor enrichment works and why it varies by device.
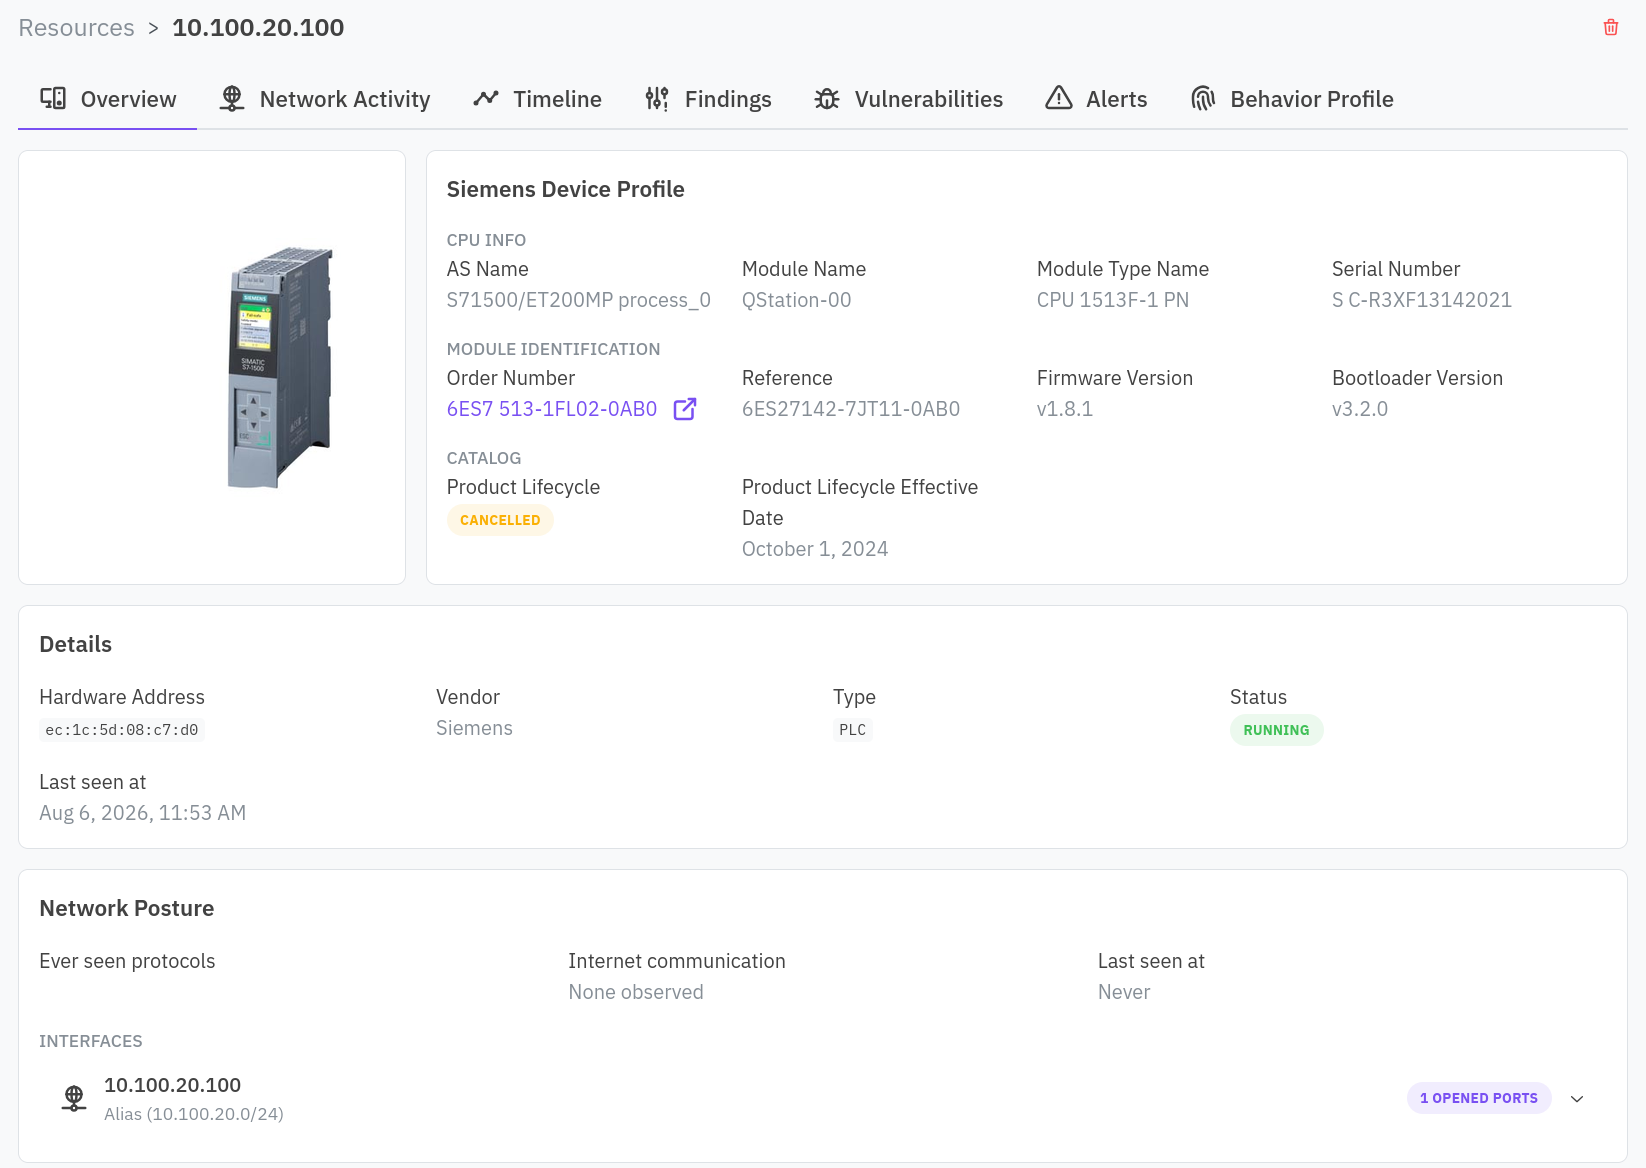
A Details card follows with the device’s identity (name, type, vendor) and network information (IP, MAC, subnet). If the sensor learned more than one IP address for the resource, a Network Posture card replaces the plain network details with ever-seen protocols, whether the resource has ever communicated with the internet, when it was last seen, and an Interfaces accordion listing each IP address with its open ports and the service detected on each.
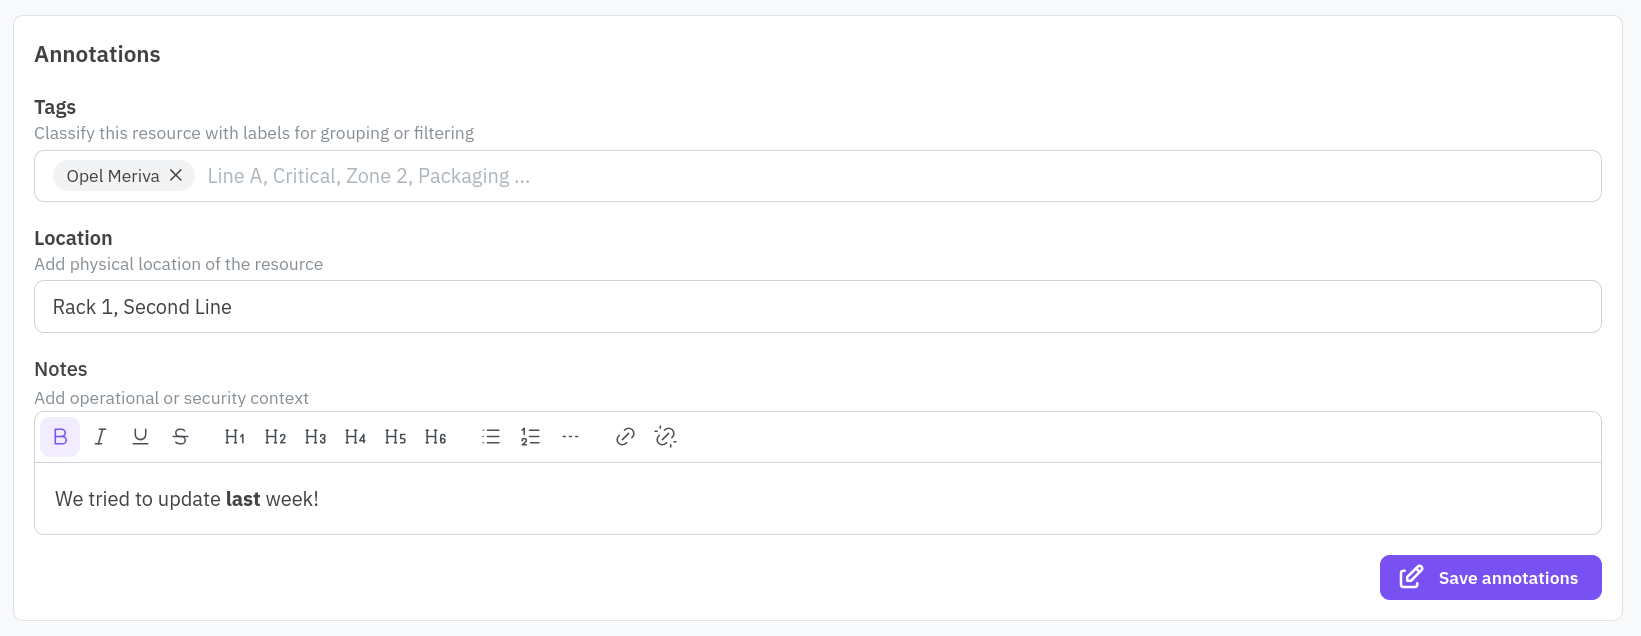
An Annotations card lets you add your own context: tags for grouping or filtering (the same tags the Resources table filters on, and the free-text place to record a zone if you use that convention), a physical location, and free-form notes. Click Save annotations to persist them.
Network Activity
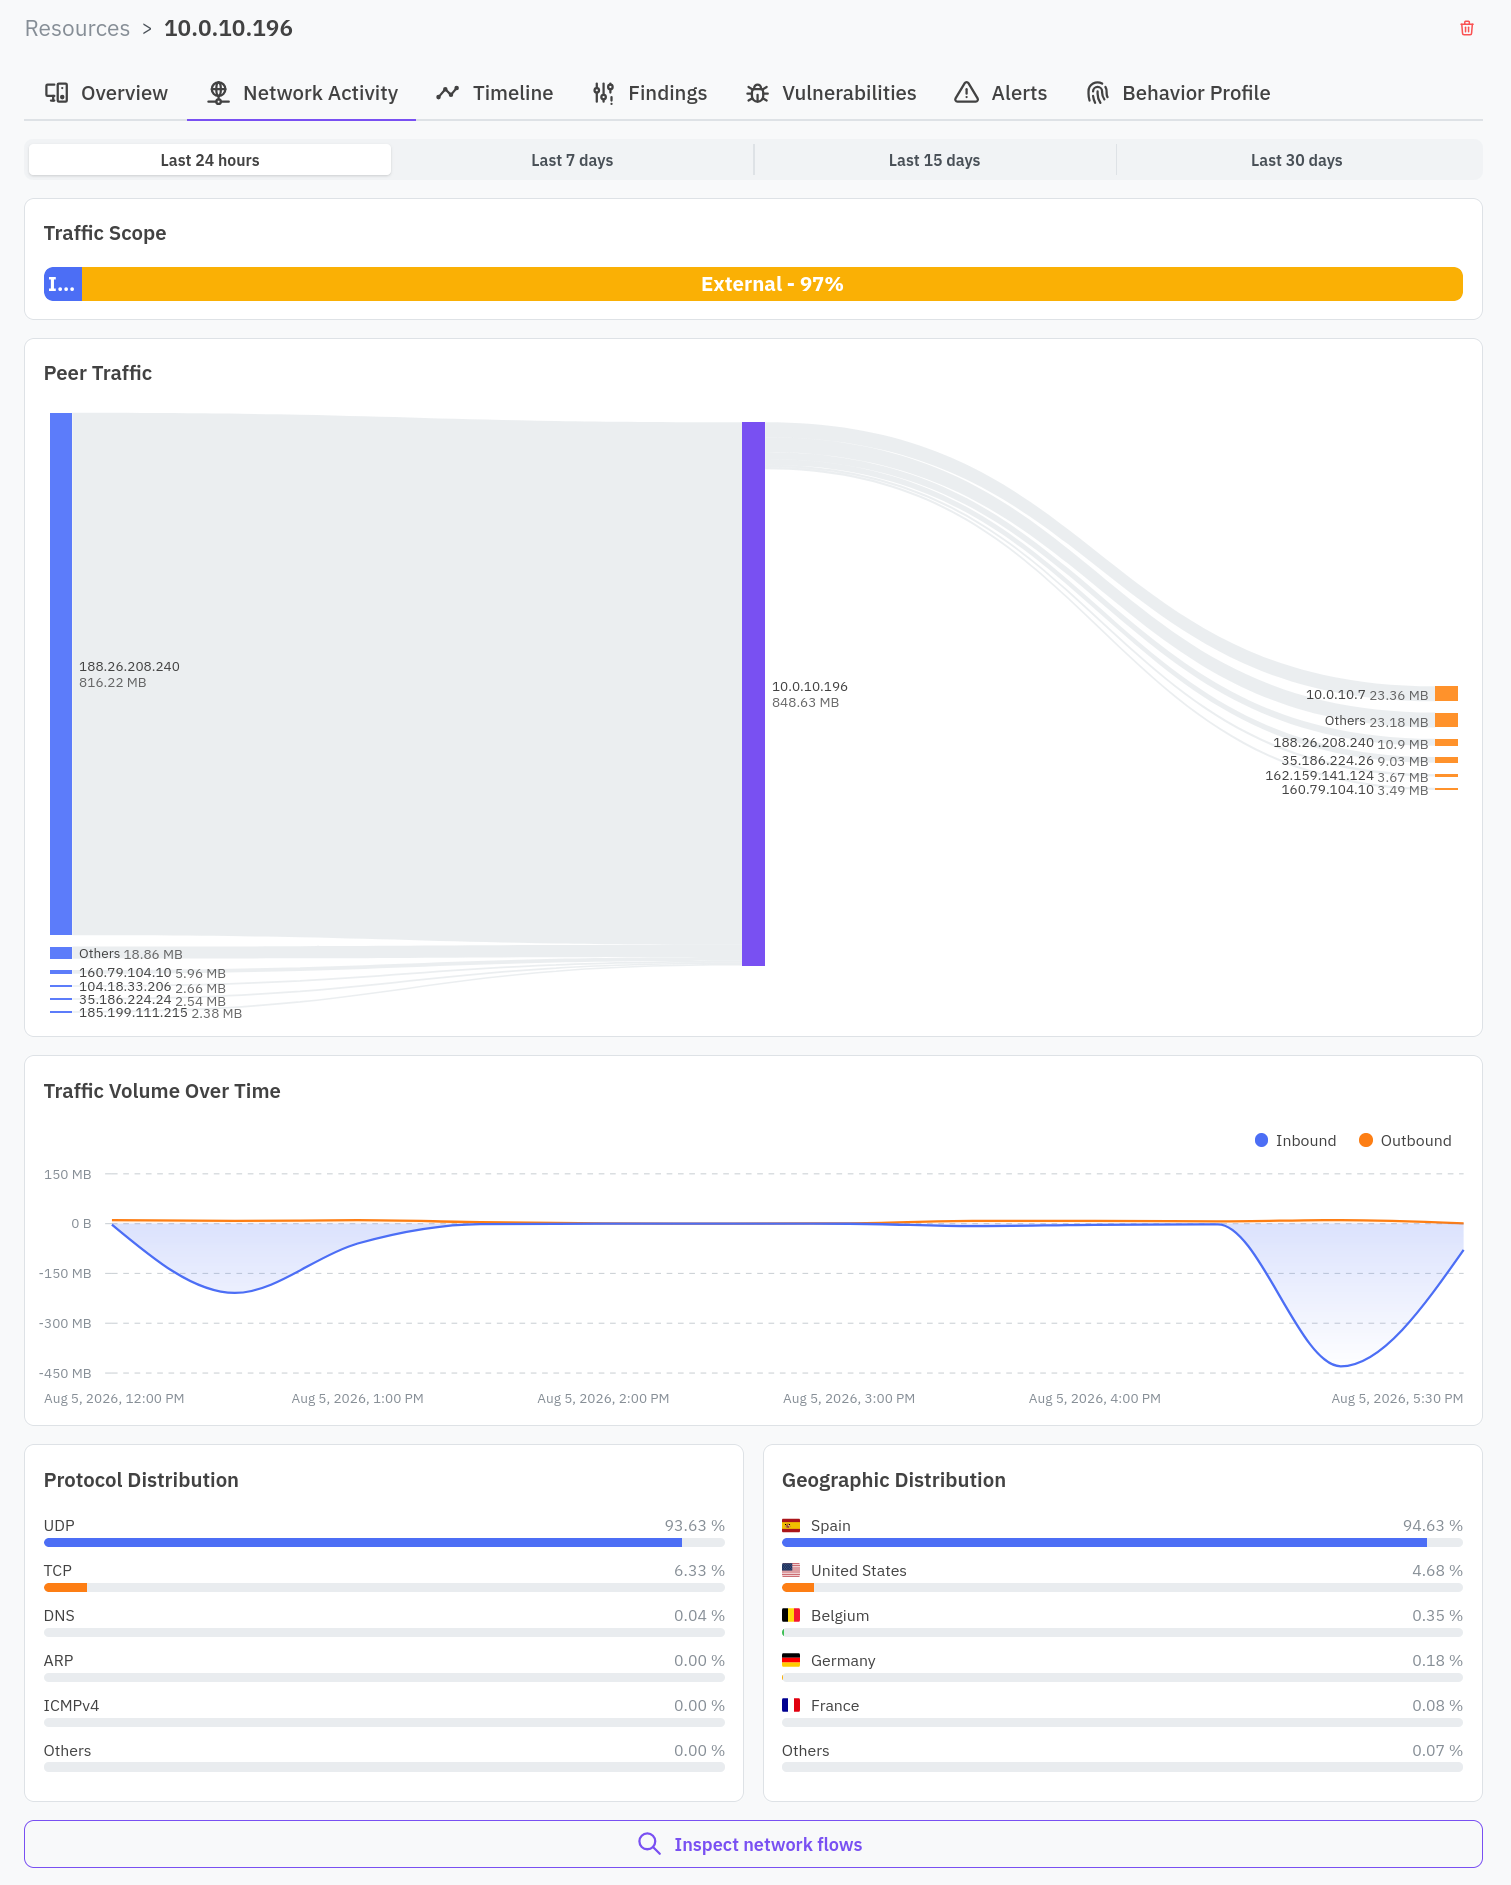
A time window control switches the charts below between the last 24 hours, 7 days, 15 days, and 30 days. The charts cover Traffic Scope, Peer Traffic, Traffic Volume Over Time, Protocol Distribution, and Geographic Distribution, followed by a table of the individual flows involving this resource. See Network traffic and flows for what a flow records and how coverage depends on port mirroring.
Timeline
A chronological list of changes detected for this resource: configuration changes and visibility changes (appearing or disappearing from the network), one entry per snapshot where something changed. See Snapshots and change detection.
Findings
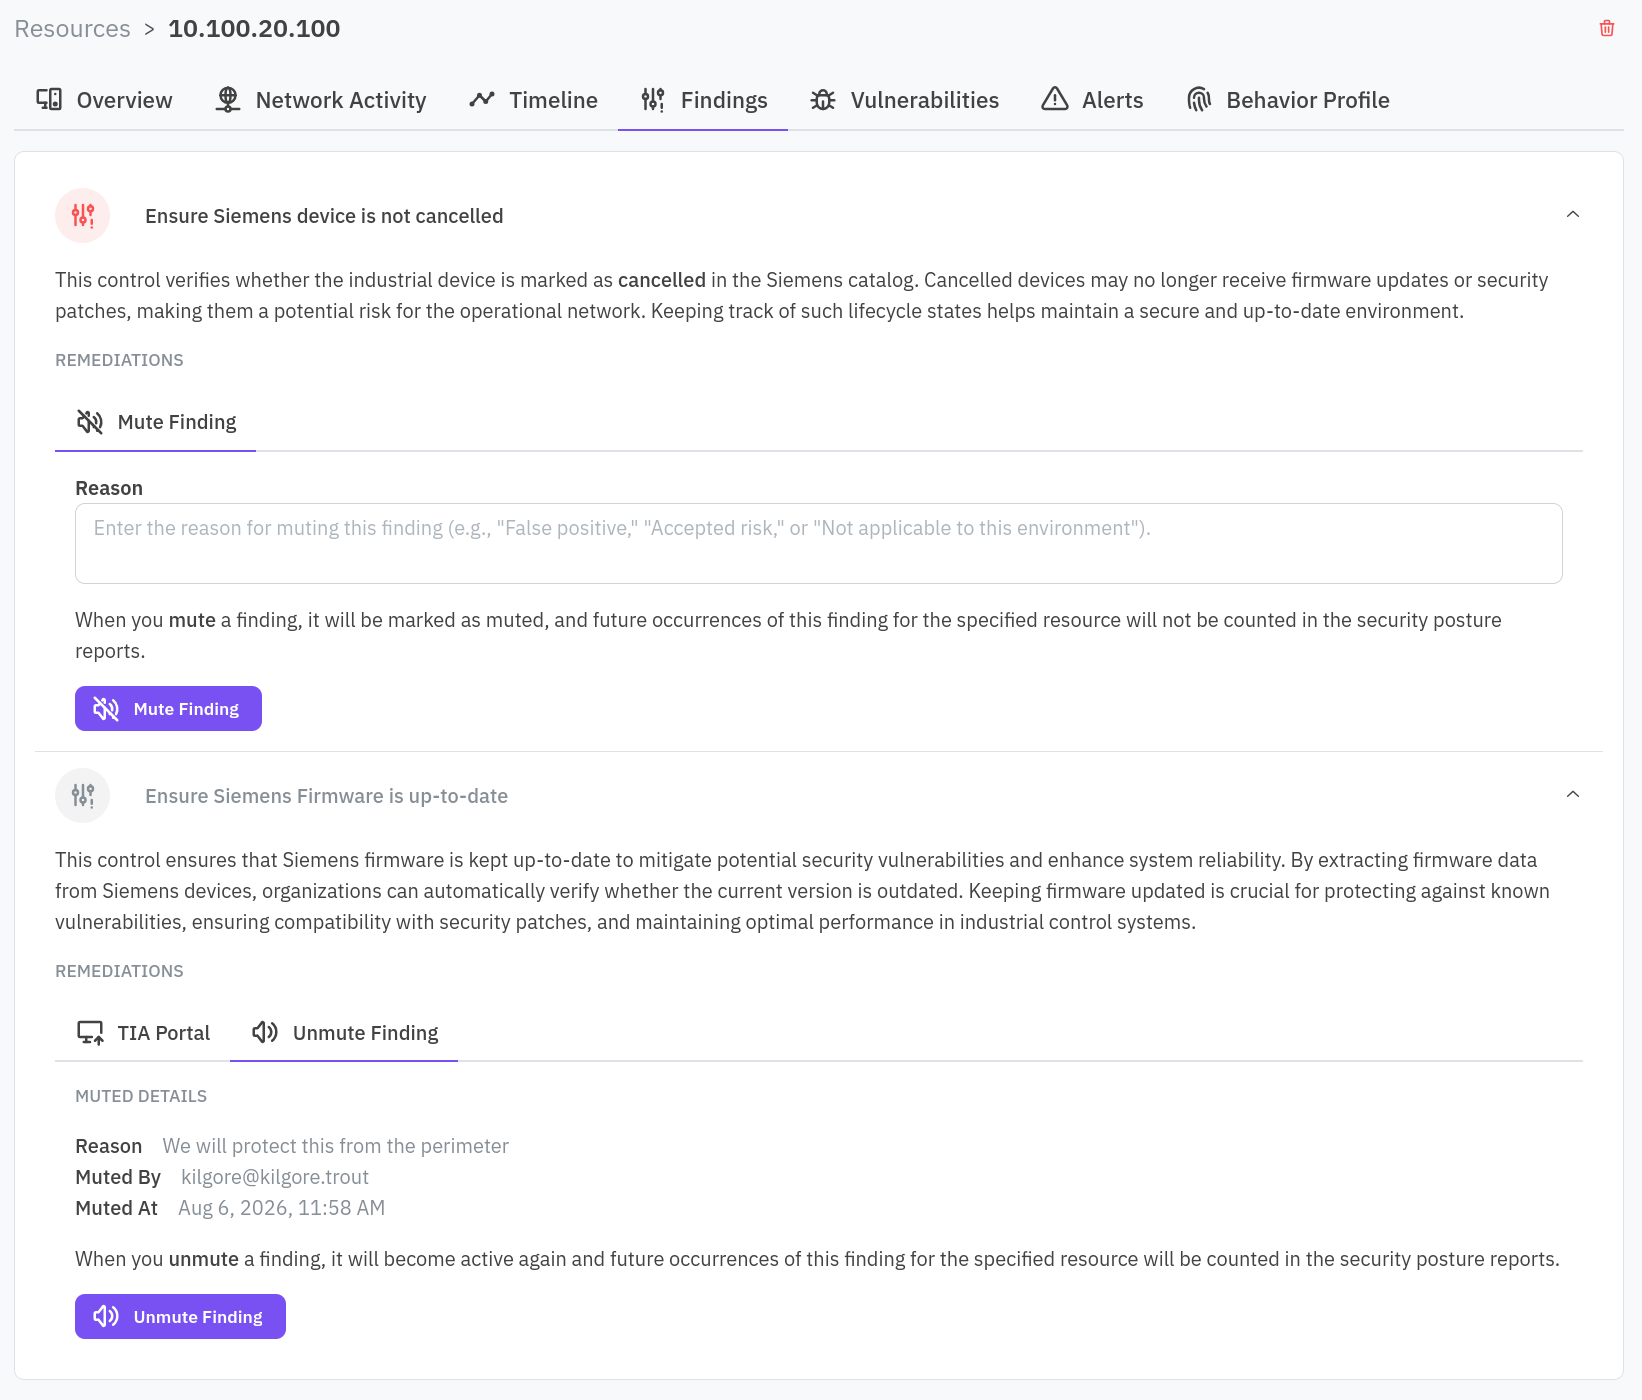
Findings scoped to this resource, grouped with a rationale and a remediation for each. Click Mute on a finding to exclude it from future compliance scoring: you must provide a reason (for example “False positive,” “Accepted risk,” or “Not applicable to this environment”), which is recorded together with who muted it and when. See Risk model for how muting affects a benchmark’s score, and Findings for the facility-wide findings queue.
Vulnerabilities
CVEs matched to this resource specifically. See Vulnerabilities for the facility-wide list and CVE detail, and Vulnerability model for how a match is made.
Alerts
Alert groups that involve this resource. See Alerts for triaging an alert group.
Behavior Profile
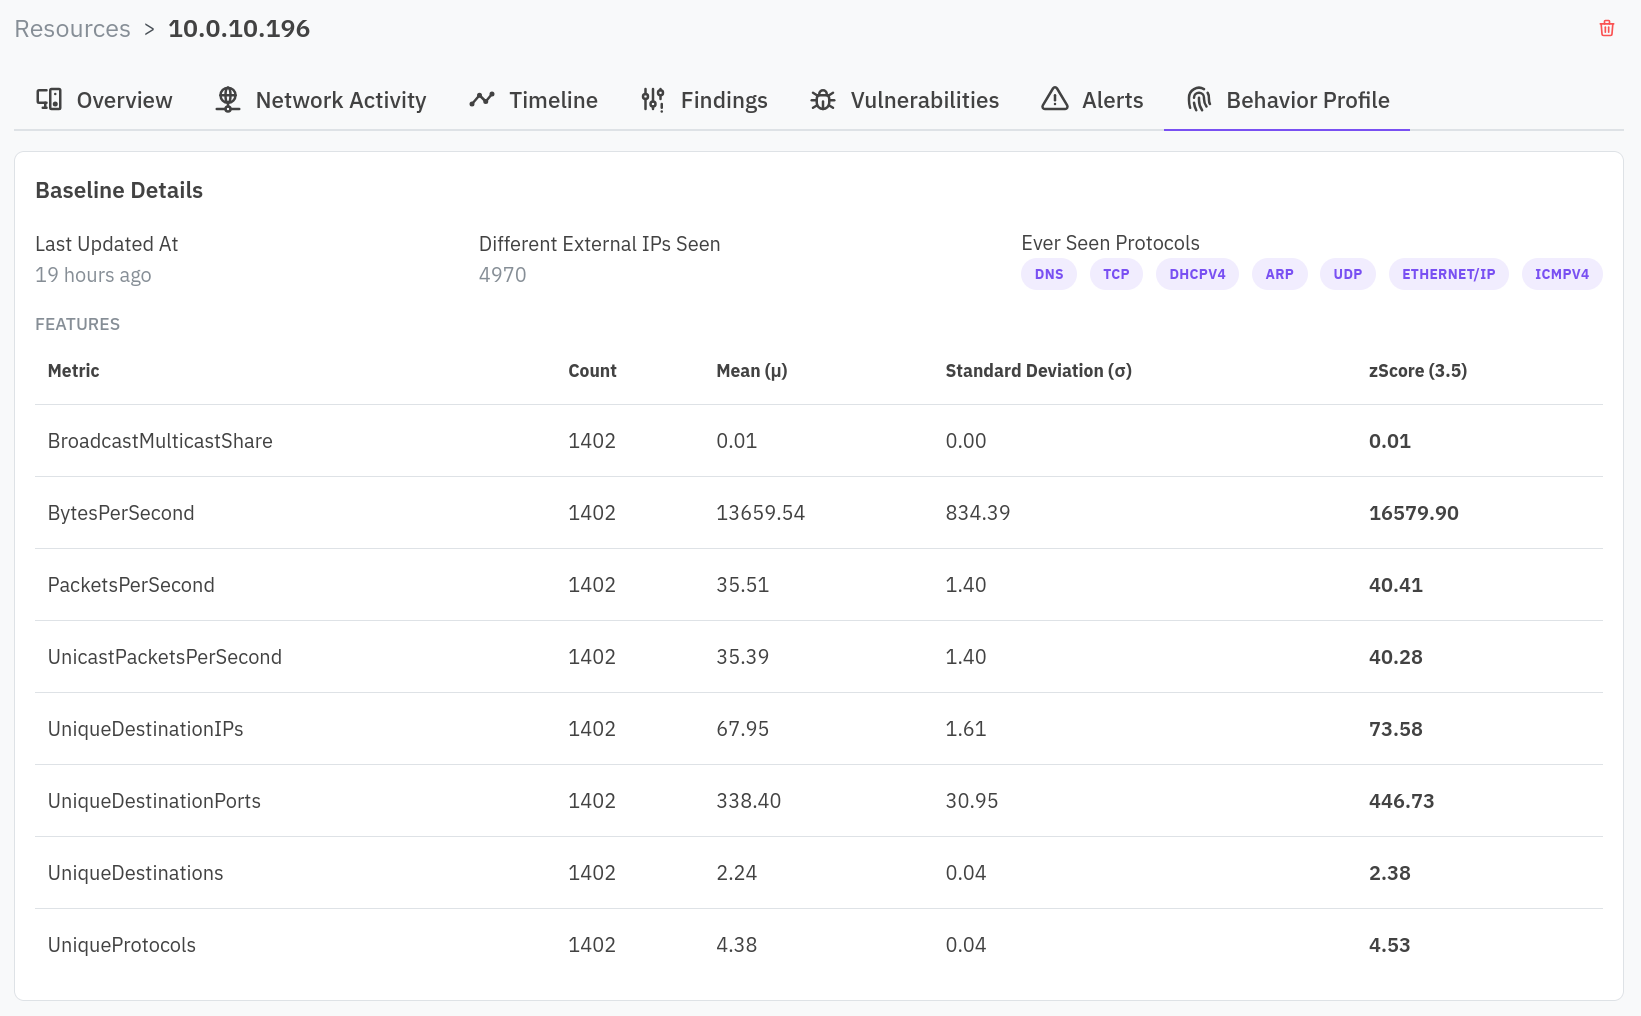
The statistical baseline the sensor has learned for this resource: when it was last updated, how many distinct external IPs it has ever talked to, which protocols it has ever used, and a Features table of the tracked metrics with their count, mean, standard deviation, and the deviation threshold that would trigger an anomaly. A metric with fewer than 288 observations is shown dimmed, meaning the baseline for it is not yet reliable. See Baselines and anomaly detection for what is tracked and when it becomes usable.
Forget a resource
Click the trash icon next to the resource’s name to remove it from the inventory and the network map immediately. Past alerts and events stay in the facility’s logs for audit purposes, and the resource is automatically rediscovered if it generates new network traffic.