Overview dashboard
The Overview dashboard is the landing page for a single facility. It answers “how is this facility doing” without requiring you to visit Inventory, Risks, or Vulnerabilities first.
The KPI cards
Six cards summarize the facility as of its most recent snapshot: Last check-in, Inventory size (active resources over inactive ones), Sensor version, Findings, Vulnerabilities, and Alerts Today.

Alerts Today counts alerts triggered since midnight, everything else reflects the latest snapshot. See Snapshots and change detection for what a snapshot is and how often it runs.
Trends
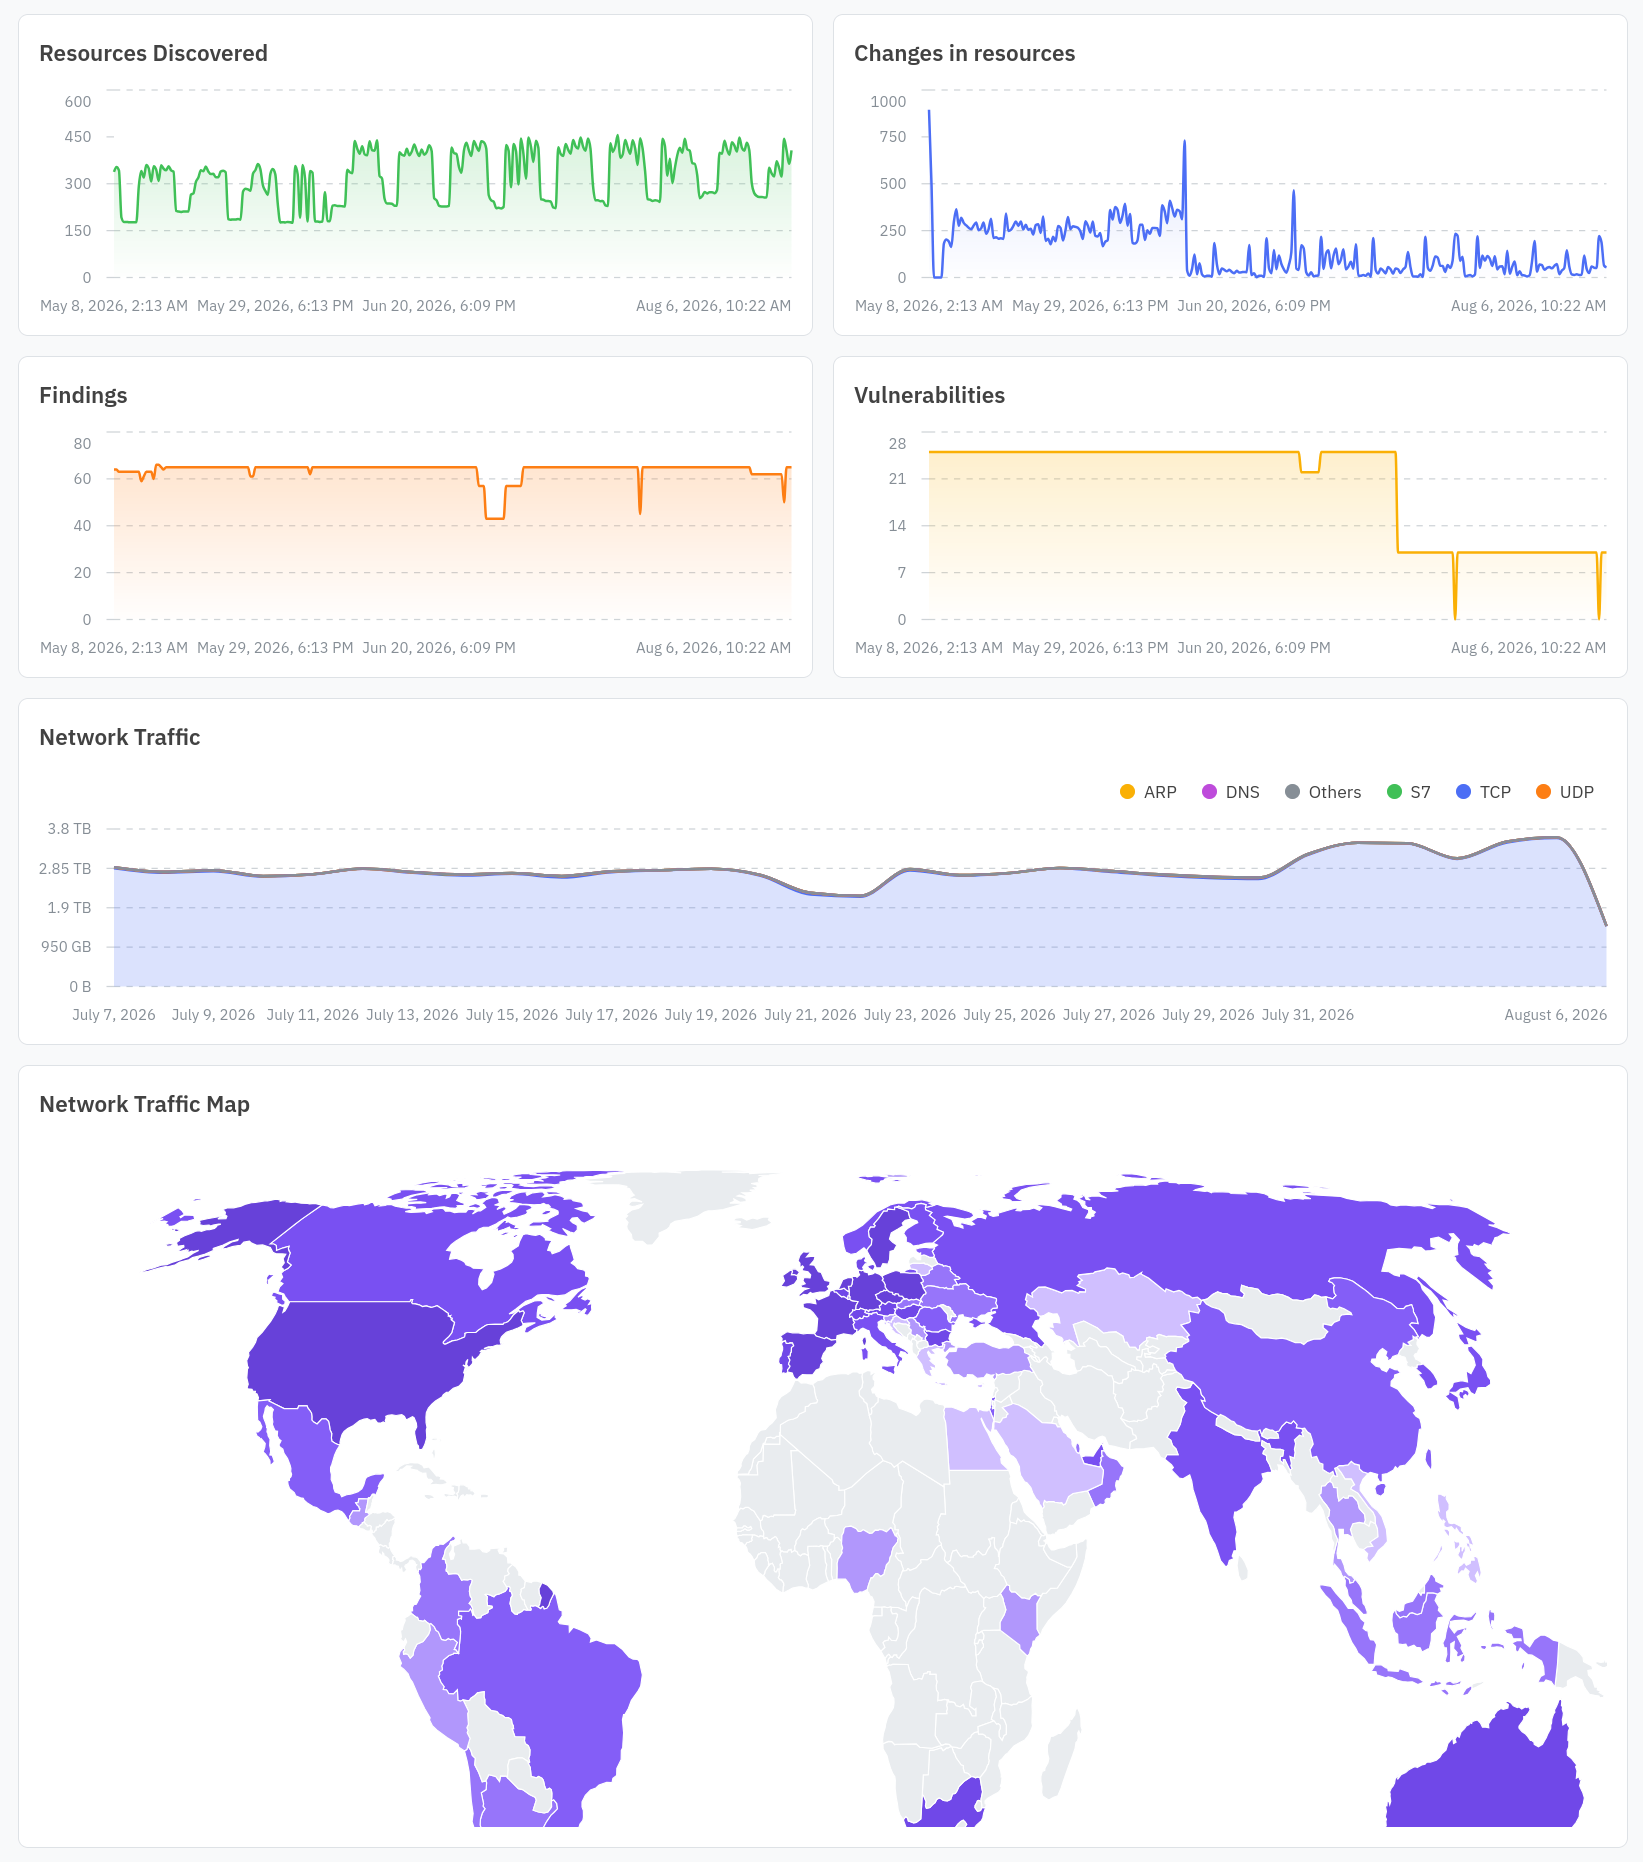
Below the KPI cards, four charts plot Resources Discovered, Changes in resources, Findings, and Vulnerabilities, each grouped by snapshot so you can see whether a metric is climbing or settling over time. A Network Traffic chart and a Network Traffic Map (traffic by country) follow, built from the same flow data covered in Network traffic and flows.
If the facility has no snapshots yet, for example right after the sensor is deployed, the dashboard shows an empty state instead of these charts. See the quickstart for what to expect during that window.